

 RTI Act

Environmental Monitoring, Pollution Assessment and Mitigation Laboratory
A suitable and safe natural environment is a pre-requisite for healthy and quality of habitat life. It is possible only by environmental monitoring, pollution assessment and suitable mitigation strategies including observations and characterization of the quality of the rivers, springs, estuaries, soils, atmosphere and specific settings. Environmental pollution assessment and mitigation laboratory is integral part of the Central Chemical Laboratory (CCL) at NCESS by providing research and development methodologies/facilities which involves laboratory testing, monitoring, assessment with mitigation plans and consultancy services to a wide range of industrial companies, environmental consultants and government authorities. Environmental laboratory is equipped with qualified human resources, modern facilities and sophisticated instruments such as gas chromatography with fid detector (GC), gas chromatography coupled with mass spectrometry (GC-MS/MS), Surface area analyser (Micromeritics), liquid chromatography coupled with mass spectrometry (LC-MS/MS), Fourier Transform Infrared Spectrophotometer (FT-IR), microwave plasma atomic emission spectrometry (MP-AES), Spectrofluorometer (Fluorescence) and dedicated microbiology lab. This laboratory is capable of performing a wide range of analysis on drinking water, industrial and domestic wastewater, surface and ground water, polluted soils/sediments, trace organic pollutants in water, soil/sediments, construction materials, sludge, etc. including air quality monitoring. And also, the laboratory has involved in developing materials for mitigating the metal pollutants in water/soil and high concentration of nutrients (nitrate, phosphate) in agricultural soils and waters based on surface chemistry principles. List of instruments/facilities available with geochemical analytical laboratory and their brief details are provided below.
Instruments/Facilities available with Hydrochemical Analytical Laboratory:
- Gas Chromatography with FID Detector (GC)
- Gas Chromatography Coupled with Mass Spectrometry (GC-MS/MS)
- Surface Area Analyser
- Liquid Chromatography Coupled with Mass Spectrometry (LC-MS/MS)
- Fourier Transform Infrared Spectrometer (FT-IR)
- Spectrofluorometer (Fluorescence)
Gas Chromatography with FID Detector
Make: Perkin Elmer; Model: Clarus-580
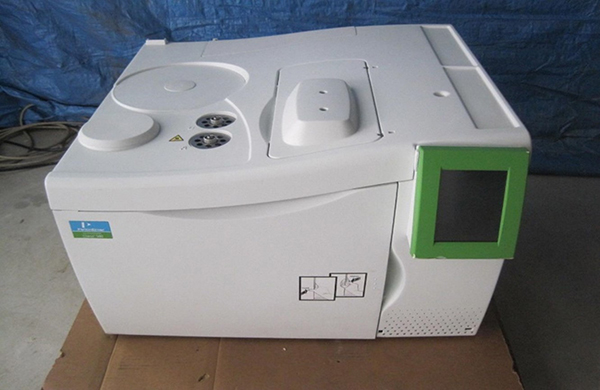
Gas chromatography is a tool involved in the analytical separation technique and is useful to identify and quantify the volatile substances in the gas phase only. In gas chromatography, the components of a sample (gaseous) are dissolved in a solvent and vaporized in order to separate the analytes by distributing the sample between two phases; a stationary phase and a mobile phase. The mobile phase is a chemically inert gas that serves to carry the molecules of the analyte through the heated column. The stationary phase is either a solid adsorbent or a liquid on an inert support. The PerkinElmer Clarus 580 Gas Chromatograph (GC) is a fully automated gas chromatograph and the system offers the capabilities required for analyzing the large numbers of gaseous samples as part of research or the routine analyses. All instrument functions are set up and monitored through a touch screen with an intuitive graphical user interface that includes a real-time chromatogram display.
Gas Chromatography Coupled with Mass Spectrometry (GC-MS/MS)
Make: Thermo Fischer; Model: Trace 1310-TSQ Duo
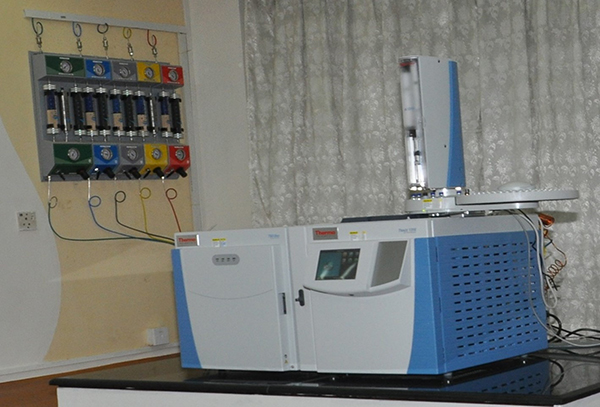
Gas Chromatography-Mass Spectrometry (GC-MS/MS) is a combination of two different analytical techniques, Gas Chromatography (GC) and Mass Spectrometry (MS) and is used to analyse complex organic, biochemical mixtures and permanent gases, sometimes it’s referred as GC-QQQ system. The GC-MS/MS system consists of two main components, Gas Chromatography (GC) portion which separates different compounds in the sample into “pulses” of pure chemicals based on their volatility (volatile and semi-volatile compounds) with great resolution, by flowing an inert gas (mobile phase), which carries the sample, through a stationary phase fixed in the column, whereas the Mass Spectrometry (MS) portion provides detailed structural information as the pure compounds exits the chromatographic column and can exactly be identified and quantified (with reference to the standard concentration) according their mass-to-charge ratio (m/z) hence, the combination of GC-MS is unique in identifying the compound with very high sensitivity and selectivity. And the MS/MS system involves the mass spectrometric analysis of the precursor ions which are obtained by GC-MS system, this future generally useful in detection and potential identification of chemicals in the presence of other chemicals (in a complex mixture) with high sensitivity. The GC-MS/MS system from Thermo scientific company of model number Trace-1310 coupled with TSQ Duo with automatic sampler and inbuilt software for communicating with system. This instrument become a highly recommended tool for monitoring and tracking trace organic pollutants in the environment. Determination of chloro-phenols in water and soil, polycyclic aromatic hydrocarbons (PAH), unleaded gasoline, dioxins, dibenzofurans, organo-chlorine pesticides such as endrin, dieldrin, herbicides, phenols, halogenated pesticides are very convenient to be screened by this facility.
Liquid Chromatography coupled with Mass Spectrometry (LC-MS/MS)
Make: Agilent, Model: 6420
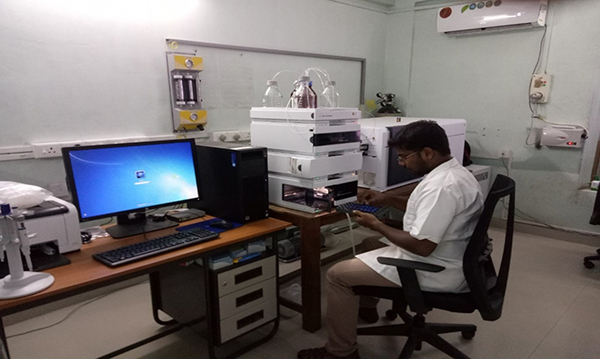
Liquid Chromatography (LC) coupled with the mass spectrometry (MS/MS) is a powerful analytical technique that combines the separating power of liquid chromatography with the highly sensitive and selective mass analysis capability of triple quadrupole (QQQ) mass spectrometry. A sample solution containing the analytes of interest are pumped through a stationary phase (LC column) by a mobile phase flowing through at high pressure. Different chemical interactions between the components of the sample, stationary phase and the mobile phase results in different migration rates through the LC column which leads to the separation of mixture analytes into pure chemical compounds. The wide variety of stationary phase and mobile phase combinations allow for customizing a separation to suit many complex solutions. After elution from the LC column, the effluent is directed to the mass spectrometer. The mass spectrometer for an LC-MS/MS system has an ionization source where the LC column effluent is nebulized, de-solvated and ionized in order to create the charged particles. These charged particles then migrate under high vacuum through a series of mass analyzers (quadrupole) by applying electromagnetic fields. A specific mass/charge precursor ion (m/z ratio of parent ion) is targeted to pass through the first quadrupole, excluding all other mass/charge ratio particles. In the collision cell, the selected mass/charge ions are then fragmented into product ions (or daughter ions) by collision with an inert gas. The third quadrupole is used to target specific product ion fragments. The resulting isolated product ions are then quantified with an electron multiplier. This transition of ions from the precursor to product ion is highly specific to the structure of the compound of interest and therefore provides a high degree of selectivity. The lab equipped with Agilent-6420 LC-MS/MS instruments with C18 Column of 15cm length and 2.5μm pore size. And the instrument is tuned to identify and quantifying of polar organic molecules for example acephate and fenvalerate pesticides in natural water/soil/sediment samples. However, prior to injection of the water samples the organic residue in the samples must be pre-concentrated by using the standard EPA methods while the residue of soil/sediment sample must be extracted by using the digestion techniques or by using the suitable QuEChERS for the targeted molecules.
Surface area analyser
Make: Micromeritics; Model: Tristar-3020kr
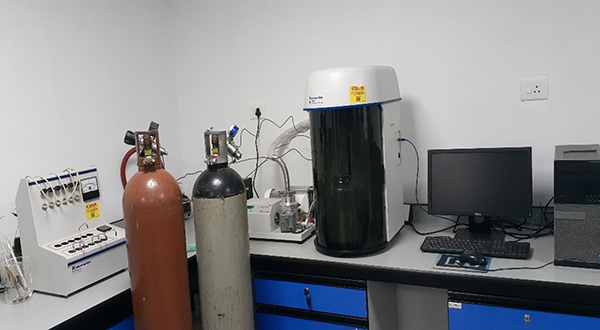
This instrument is used to determine the specific surface area of powders, solids and granules. It analyses single and multipoint BET surface area, thickness, pore area distributions (BJH method), total pore volume, pore surface area, t-Plot, Langmuir surface area and Isotherm plots. It can analyse the surface area of samples up to 0.02 m2/g using krypton gas. It can analyse three samples at a time and the working principle is the adsorption/desorption isotherms and pore volumes of the adsorbents were determined by nitrogen adsorption–desorption isotherms, measured at 77 K. The shape of the typical isotherm provides various useful information on the large uptake of nitrogen at low P/P0 indicating filling of the micropores. The linear portion of the curve represents multilayer adsorption of nitrogen on the surface, and the coverage upward portion of the curve represents multilayer adsorption of nitrogen on the surface and the concave upward portion of the curve represents filling of meso-and micropores. The Surface Area Analyser is also capable of determining the pore size distribution in solid matrix.
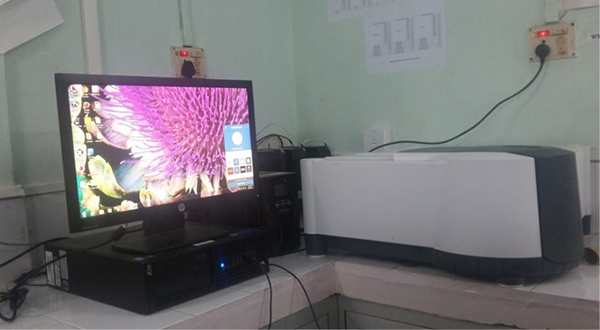
Fourier Transform Infrared Spectrometer (FT-IR)
Make: Agilent; Model: Cary-630
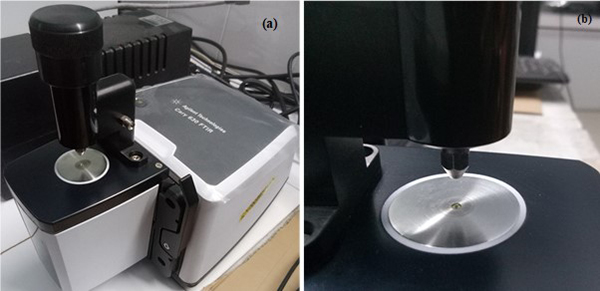
Infrared spectroscopy provides specific information about the vibration of chemical bonding in a molecular structure. Vibration spectrum represents a fingerprint of a sample making it useful for analyzing organic, inorganic and biological compounds. It is a major versatile tool for the qualitative analysis and quantitative identification of every different form of materials. During Fourier transformation, the interferogram pattern gives rise to the spectrum which is carried out mathematically with a computer. The present model (Cary 630 FTIR) has a spectral range of 100-4000 cm-1 with a spectral resolution of < 2 cm-1. The instrument is capable of identifying the functional groups present in a compound, useful for quantitative estimation of resins from industries as well as chemicals, pharmaceuticals, petroleum products, oil and grease in water etc.
Spectrofluorometer
Make: Agilent; Model: Carry Eclipse
Spectrofluorometer uses high intensity light sources to bombard a sample with as many photons as possible. This allows for the maximum number of molecules to be in an excited state at any one point in time. The light is either passed through a filter, selecting a fixed wavelength, or a monochromatic in nature, which allows a wavelength of interest to be selected for use as the exciting light. The emission is collected at 90 degrees to the exciting light. The emission is also either passed through a filter or a monochromatic before being detected by a photomultiplier tube, photodiode, or charge-coupled device detector. The signal can either be processed as digital or analogue output. The Spectrofluorometer consists of a light source, an excitation monochromatic, a sample holder, an emission monochromatic, and a detector. The reference is generally a solution of a strongly fluorescent molecule with a broad absorbance spectrum such as rhodamine. The reference is necessary to correct for lamp output, especially when varying the excitation wavelength, and to correct for differences in detector sensitivity. The spectrofluorometer has the capabilities of measuring the fluorescence signature of an analyte in a sample based on its specific excitation and emission wavelengths. The fluorescence signature can be correlated to the concentration level of the analyte in the sample and mainly used for plant pigment analysis and PHC (Petroleum Hydrocarbon) detection.