

 RTI Act
- You are here:
-
Home

-
Discussion Forum
- Uncategorised
Uncategorised
Mrs. Liji. T. M
Scientific Assistant Gr. B,Environmental Hydrology Group (EHG)
Email : This email address is being protected from spambots. You need JavaScript enabled to view it.
Phone(Off) : 0471-2511659
Fax : 0471-2442280
Education:
| M. Sc. | : | 2004, M.Sc. Chemistry, University of Kerala. |
Professional career:
| 2014 | - | Present | Scientific Assistant Gr. B, National Centre for Earth Science Studies. |
| 2012 | - | 2014 | Technical officer Gr-II, Centre for Earth Science Studies. |
| 2007 | - | 2012 | Technical officer Gr-I, Centre for Earth Science Studies. |
Awards:
- Best Employees Award 2020, (Group B Employee) by the Ministry of Earth Sciences , Govt. of India
Publications:
- Ragi M.S., Saranya P., Krishnakumar A., Upendra B., Liji T.M., Anoop Krishnan K., Padmalal D. (2017) Geochemistry of heavy metals and CHNS composition in the sediments of Netravati River Basin: Insight into the pollution aspects. Journal of Indian Association of Sedimentologists, Vol. 34, Nos. 1 & 2. (2017), pp. 121-125. (Peer Reviewed Indian Journal)
- K. Anoop Krishnan, K. Ajmal, A.K. Faisal, T.M. Liji, Kinetic and isotherm modeling of methylene blue adsorption on to kaolinite clay at the solid-liquid interface. Separation Science and Technology, 50 (2015) 1147-1157.
In Proceedings of Conferences/ Seminars:
- Prasenjit Das., Maya K., Liji T M., Anoop Krishnan K and Vishnu Mohan S Carbon, Nitrogen and Sulphur contents in the sedimentary archives of Central Kerala coast, SW India- Its palaeoclimatic significance, ‘National congress and 33rd Convention of Sedimentologists with emphasis on Energy Resources and Climate change’ at BHU, Varanasi. 12-14, November. 2016.
- Vinu V. Dev, S.R. Sachin, A.K. Faisal, S. Arya, T.M. Liji, K. Anoop Krishnan, Aqueous nutrient flux and sediment heavy metal contamination in Cochin Backwaters: A systematic spatial pattern study on monthly basis. In: Proc. National Seminar on ‘Recent and Emerging Advances in Chemical Science (REACS-2015)’ held at Department of Chemistry, All Saints’ College, Trivandrum, 08-09, January (2015) 60.
- Seema K. Nair, A.K. Faisal, T.M. Liji, R.S. Baiju, K. Anoop Krishnan, Comparative study of malachite green adsorption onto china clay and cassava starch: Kinetic and isotherm profile In: “Proc. International Conference on ‘Emerging Frontiers and Challenges in Chemistry’ held at Department of Chemistry, All Saints’ College, Trivandrum, 17-18, February 2014, (2014) 17-19
- L. Lakshmi, S. Arya, A.K. Faisal, T.M. Liji, K. Anoop Krishnan, Adsorptive removal of methyl red from aqueous solution using tea waste and fruiting branches of pepper. In: “Proc. International Conference on ‘Emerging Frontiers and Challenges in Chemistry’ held at Department of Chemistry, All Saints’ College, Trivandrum, 17-18, February 2014, (2014) 74-76.
- S. Arya, K.N. Noufal, A.K. Faisal, Sibin Antony, K.K. Mathew, R.S. Baiju, T.M. Liji, K. Anoop Krishnan, Conservation of spring sources in the Western Ghats: Focus on its quality and management for preserving the biodiversity. In: ‘Proc. National Seminar on ‘Western Ghats Biogeography, Biodiversity & Conservation’ held at Department of Botany, NSS College, Manjeri, Malappuram, 14-16, February 2013. (2013) 152-160.
Sakunthala.C
Scientific Officer Gr 3
Email : This email address is being protected from spambots. You need JavaScript enabled to view it., This email address is being protected from spambots. You need JavaScript enabled to view it.
Phone(Off) : 0471-2511609
Phone(Res) : 0471-2215003
Fax :
Education:
| B.A | : | 1979, Geography, University of Kerala. |
Professional career:
| 2014 | - | Present | Scientific Officer Gr.III, National Centre for Earth Science Studies. |
| 2003 | - | 2014 | Technical Officer Gr. II to Gr. V, National Centre for Earth Science Studies. |
| 1998 | - | 2003 | Technical Officer(Gr.I), CESS. |
| 1992 | - | 1998 | Senior Technical Assistant, RAD, CESS. |
| 1987 | - | 1992 | Junior Technical Assistant, RAD, CESS. |
| 1982 | - | 1987 | Technician Group2, Grade2 , RAD, CESS |
| 1980 | - | 1982 | Junior Technician, RAD, CESS |
| 1979 | - | 1980 | Compiler, RAD, CESS |
Training:
- Undergone 2 days Human Resource Development Training programme conducted by CESS,
- Participated and imparted training for Panchayat Resource Mapping Programme to the volunteers pertaining to the project ADB-1 at CESS, and in 8 panchayats at Alappuzha district.
- 15 days training at CESS for 96 selected volunteers from 8 panchayats. In field trained 539 volunteers from 8 panchayats in Alappuzha district.
- Participated in theUser interactive workshop on integration of natural resource potential (nrp)and socio-economic development (sed) for micro level planning in kottayam district – February 2006.
- Participated Work shop at Pathiramanal “ Pathiramanal biodiversity conservationand and biopark project “- 17th august 2006
- Attended XVIII Kerala Science Congress at CESS- (29.1.2006 to 31.1.2006.)
- Conducted classes during Training programme on Resource Mapping in connection with the Golden Jubilee Celebrations of the Economics Department ST. THOMAS COLLEGE, KOZHENCHERRY
- Attended 3 days National Brain Storming Workshop on “Quantitative Geomorphology” (Sponsored by DST, New Delhi during December 2005.)
- Attended the National Symposium on Resource Management with Special Reference to Geoinformatics and Decentralised Planning, December 9-12, 2003 at Thiruvananthapuram.
- Attended one day Brain-Storming workshop on Integrated Watershed /River basin management- Experience from the Chalakudi River Basin in 2002, organized for KRPLLD,Centre for Development Studies, Trivandrum.
- Attended and assistance extended for organizing the training programme“Landscape System Analysis and Monitoring for Environmental Resource Management and Development”.(October 26th to Nov. 6th 1999) Sponserd by DST, Govt. of India.
- Attended National Symposium (ISPRS) on Resource Management with special reference to Geoinformatics and decentralised Planning, December 9 to 12, 2003 at Techno Park Thiruvananthapuram.
- Attended and extended services for organizing 3 days workshop on “Mitigation of Pamba River pollution Options Strategies and Responsibilities” on April 2004, at Thiruvananthapuram. (Indo German workshop)
- Participated in the International Conference on “Landuse Change,Biodiversity and Climate Change” at Nesamony Memorial Christian College, Marthandam, Tamil Nadu on 6th to 7th October 2008
- Participated in the Seminar on Pathiramanal Biodiversity Conservation and Responsible Ecotourism Development at Pathiramanal on June 5th ,2007.
- Participated and made arrangement for organizing 34th IIG Conference in Centre for Earth Science Studies, Thiruvananthapuram during 13th to 15th December, 2012. (Convenor: Dr. Srikumar Chattopadhyay) Focal theme of this conference was “Natural resource management and decentralized planning”. Discharge duties as Registration Committee member.
- Attended three days training programme on Arc GIS conducted by Environmental System Research Institute in Central Geomatics Laboratory from 11.03.2015 to 13.03.2015
Hydrology Group (HyG)
Scientists
Prof. N.V.Chalapathi Rao
Director & Group Head(I/C), Hydrology Group (HyG)
Email :director[at]ncess[dot]gov[dot]in, nvcrao[at]ncess[dot]gov[dot]in
Phone(Off) : 0471-2511501/2511502
Mobile : +91 9935647365
Fax : 0471-2442280
Dr. A. Krishna Kumar
Scientist E, Hydrology Group (HyG)
Email :krishnakumar[dot]a[at]ncess[dot]gov[dot]in
Phone(Off) : 0471-2511602
Phone(Res) : 0470-2603210 Mobile :+91-09447552880
Fax : 0471-2442280
Mr. Rajat Kumar Sharma
Scientist D, Hydrology Group (HyG)
Email : rk[doy]sharma[at]ncess[dot]gov[dot]in
Phone(Off) : 0471-2511613
Fax : 0471-2442280
Dr. Sreelash K
Scientist D, Hydrology Group (HyG)
Email : k[dot]sreelash[at]ncess[dot]gov[dot]in
Phone(Off) : 0471-2511646
Phone(Mob) :
Fax : 0471-2442280
Mr. Prasenjit Das
Scientist D, Hydrology Group (HyG)
Email : prasenjit[dot]das[at]ncess[dot]gov[dot]in
Phone(Off) :0471-2511605
Phone(Res) :+91-9654702337
Fax : 0471-2442280

Tooth demineralization and caries detection
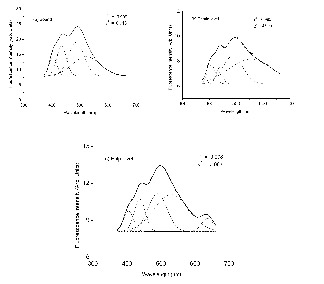
Fig. 1. The curve-fitted LIF spectra of sound, dentine level and pulp level caries from in vitro tooth samples with 337nm laser laser excitation.
For decades, dentists have relied on visual inspection, tactile examination with probe and X-rays to identify dental caries and early-stage cavitation sites. Among these, visual inspection is the favoured choice to diagnose dental caries because it is non-destructive as compared to mechanical methods such as probing, which can damage tooth structure and X-rays, which are ionizing and hazardous in nature. All of these methods have limitations affecting either their diagnostic ability or their practicality in a clinical setting. Once the caries cavity is detected by conventional techniques, tooth demineralization has usually progressed through approximately one-third to one-half of the enamel’s total thickness. Since X-rays only show good contrast when considerable mineral loss has already taken place, this technique allows detection only of already well-advanced caries. At this stage, the treatment option is drilling and filling with restorative material. Thus there is an emerging need for sensitive, clinically relevant non-invasive methods for early detection and quantification of caries lesions.

Fig. 2. Clinical trials with the LIFRS system at the Govt Dental College, Trivandrum with the inset showing the close-up
One of the significant aspects in dental caries diagnosis is that if early changes are not detected, lesion would continue to demineralize, which eventually leads to cavity formation. Once cavitation occurs, the lost tooth structure cannot be regenerated. It may be noted that tooth demineralization is difficult to diagnose in the early stages of development with the existing detection methods. Therefore, the main focus was to explore the potential of laser-induced fluorescence (LIF) and diffuse reflectance (DR) spectroscopic techniques to identify incipient changes in tooth enamel, which is crucial for decisions on treatment modalities in operative dentistry.
We have studied in detail the LIF and DR spectral features of caries tooth under different stages of caries formation both under in vitro and in vivo conditions jointly with the Chitra Dental Clinic and Govt Dental College, Trivandrum. In vitro studies using nitrogen laser excitation has shown that LIF spectral features identify the stage of caries and spectral analysis using curve-fitting technique improves the detection sensitivities (Fig. 1).
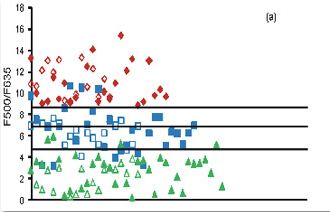
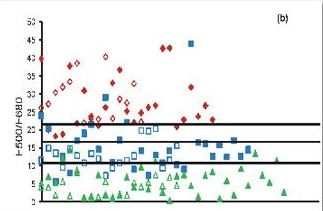
Fig. 3. Fluorescence ratio algorithm developed from 65 patients, diagnosed as incipient and advanced caries lesions, along with the 25 sites of sound teeth for a) F500/F635 and b) F500/F680 ratios. The solid symbols represent FRS ratios whereas the hollow symbols represent the blind test results from 40 patients.
In the clinical trials a diode laser emitting at 404 nm was used for excitation of fluorescence (Fig. 2). The LIF spectra of sound tooth showed a broad peak at 500 nm whereas two additional peaks were seen at 635 and 680 nm in caries tooth. In advanced caries 500 nm tooth broadens and shifts by 30 nm towards the red spectral region and the peaks at 635 and 680 become more intense. The results of this clinical study illustrate that information provided by non-invasive LIF spectroscopy has excellent potential to detect dental caries in its early stage. The fluorescence ratio (F500/F635 and F500/F680) diagnostic algorithms based on tissue autofluorescence were found to be sensitive and specific in discriminating different stages of tooth caries and in detecting early changes in tooth enamel that lead to caries formation (Fig. 3). Among the various ratios studied, F500/F635 ratio was found more suitable for detecting early tooth caries with 100% sensitivity and 97% specificity with PPV of 0.97 and NPV of 1.00. Our results confirm that the classification of tooth caries with 404 nm excitation allows precise visualization and quantification of both the dental hard tissues from the intrinsic green fluorescence as well as the red fluorescence of bacterial origin. Further studies are necessary to test the efficacy of LIF in detecting secondary caries.
Early Detection of Oral Cancer
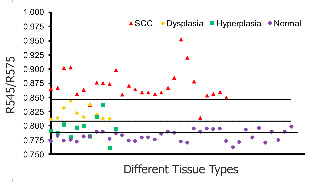
Fig. 1. Combined DR spectral ratio R545/R575 scatter plot discriminating different grades of cancer from 48 sites in 29 patients compared with the mean normal values in 36 healthy volunteers.
Oral cavity cancer represents a significant health problem owing to its high rate of incidence in India as well as the world over. Nearly 85% of the oral cancers are categorized as squamous cell carcinoma. As with all cancers, the prospect of curability is better when the malignancy is detected in an early stage. Therefore, regular screening of apparently healthy people is rewarding as it permits diagnosis before visible symptoms develop. Premalignant dysplastic lesions are routinely detected through invasive biopsy followed by histopathological examination, which is considered as the gold standard. However, histopathological examination has several drawbacks. A suspicious lesion that is premalignant at some part may not be malignant at another location. Therefore, biopsy from one location of the lesion may not be a representative of the entire lesion. Also, the resemblances of tissue inflammation and irritation with premalignant oral mucosal alterations and field cancerous changes are often challenging. This usually leads to random or repeated biopsies causing discomfort to the patients. Multiple stage sample preparations and processes are also time consuming and increase pathological costs.
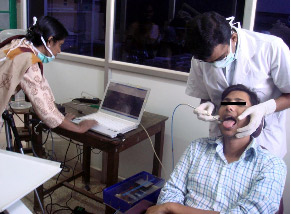
Fig. 2. A clinical trial to detect oral pre-cancer using the LIFRS device developed in the lab.
The prevalence of various optical spectroscopy techniques has been increasing and is getting greater recognition and acceptance these days owing to their noninvasive nature of tissue characterization. Among these techniques the potential of laser-induced tissue autofluorescence and diffuse reflectance (DR) are immense, but not yet fully explored for detection of precancerous lesions (Fig. 1).
The Biophotonics laboratory of the CESS has developed a LIFRS system for point monitoring and diagnosis of oral cavity cancer from autofluorescence and DR spectral features. A multi-spectral DR R545/R575 ratio imaging system based on EMCCD camera was used in a clinical trial to study the tissue morphology across the entire lesion in real time for identifying the most malignant site in a lesion for biopsy and in oral cancer detection (Fig. 2).
News and Events
Research Updates
- Tracing the Late Quaternary coastal evolution of Central Kerala, India
- Imaging of moho topography with conditional generative adversarial network from observed gravity anomalies
- U-Pb geochronology of rutiles from Southern granulite Terrane, India
- Metamorphic and tectonic evolution of the Southern Granulite Terrane, India
- Origin of TTGs and high-K granitoids in the Bundelkhand Craton, Central India
- Detrital zircons in crustal evolution: A perspective from the Indian subcontinent
- Age of Kaladgi Supergroup, India
